Standard means like Fourier analysis decomposes the time series into a frequency spectrum as a sum of sine or cosine wave components at various frequencies that will represent the original time series.
A. The historic color-music problem or how one maps musical or other data into a visible display that evokes visually the acoustic and aesthetic aspects of music, is one that has been around for centuries. Many have attempted to resolve the problem. Previous solutions have always been those involving arbitrary assignments of a scale of numbered musical notes to a like scale of numbered color intervals.
B. The Harmonic Color Code System satisfies the "color-music" transform by constructing a color pattern of the entire frequency timbre envelope of a given tone, the frequency components (harmonics) present in a signal yielding a spectral array.
Humans are visual animals (with 1.5 million nerve fibers from each eye versus some 100,000 from each ear). The visual display exploits the human's large bandwidth visual system and permits the display of data with frequency components even beyond the limits of ordinary hearing to the eye as color and pattern.
This invention is intended for the teaching and analysis of music, structural hearing, for the mute, deaf, hearing impaired, autistic and others that can benefit from a sound-to-vision sensory substitution.
The HCCS has applications in many fields of data analysis, from music and acoustics to physics, mathematics or the analysis of cetacean sounds and communication interfaces, to name some applications of primary concern to us.
For simplicity, the terms signal, data, musical data, or a plethora of other possible signal sources (analog, digital, mathematically or synthetically generated etc.) that can be analyzed using the Harmonic Color Code System (hereafter - HCC - HCCS) will be referred to as "data".
This patent describes an innovative signal mapping system which permits the eye to see patterns present in any vibrational energy. It also describes devices which embody the mapping systems. The various devices that implement this mapping are here called the Harmonic Color Code Display Device or the Harmonic Color Code Display or simply "the display". This invention thus comprises both a mapping system and any devices that use it.
Means are described for other devices that, in conjunction with the proper data collection and the HCCS, permit the solution of the "cocktail party effect" i.e. the localization and identification of several simultaneous sound or data sources.
Other means are described here for devices that extend the concept to
binaural hearing, recording and presentation of data to various media other
than air, especially underwater. These relate specifically to the HHC when
used as part of a communication interface for the analysis and developed
translation of the patterns and meanings in the sounds of cetacea (dolphins
and whales). The HCC is integral to this application because it permits
visual appreciation of patterns in signals beyond the range of human
hearing.
Description of Current Art
There exist a myriad of mappings or transforms that take data from various sources and display them visually. Among these are Cartesian graphic, or frequency analysis, where a time series of data is transformed into frequency space using Fourier, LaPlace, Z-transforms, or numerous other methods. For example, the signal of speech or a musical instrument can be recorded, digitized, and plotted as a time series graph of amplitude against time showing variations of air pressure.
|
Standard means like Fourier analysis decomposes the time series into a frequency spectrum as a sum of sine or cosine wave components at various frequencies that will represent the original time series. |
|
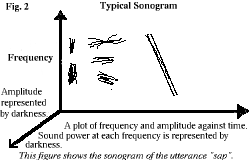
This diagram shows a schematic of one such display: - a sonogram - of the utterance "SAP". The "s" is a white-noise hiss - with frequency components widely distributed. (Sound amplitude in the figure is represented by darkness.) The horizontal bands, or formats, represent sound amplitude in the throat, mouth, and nose, respectively. The vertical line at the right is the "p", a plosive stop, which appears as a sharp frequency spike. |
| A musical instrument similarly analyzed creates a frequency spectrum as shown here. |
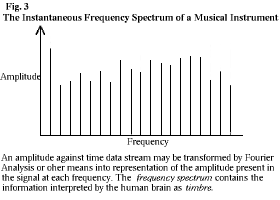 |
| The vertical lines are at differing lengths according to sound amplitude present in the instrument's timbre at each frequency. |
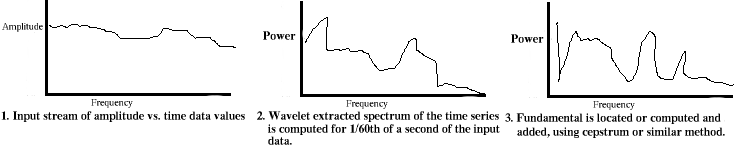
| Common means used to transform data, sounds, speech, or music into visual patterns are shown below |
 |
In the current instance, the Harmonic Color Code System (HCCS) displays harmonic relationships (such as the partials and other sound spectra of musical instruments) by assigning a color code to frequency that is then mapped onto a pattern of concentric rings or a torus centered in a display such as a color CRT, such that time or the logarithm of time and frequency increases as it moves radially out from the center, event one (1) of sixteen (16).
A signal of the arbitrary fundamental frequency of fO is mapped to the center, (event one and is the origin of the display co-ordinate system. As the signals arrive and are processed by the device, colored patterns appear on the display, (according, to color by analogy: pitch and color) and position according to frequency. With a continuous signal, the display appears as a colorful, changing pattern.
The invention is well suited, in particular, to plotting phase spaces
from Catastrophe Theory (see Bibliography
#'s 11 & 16, Poston & Woodcock.) Their topology can be displayed
having sonic-color pattern dimensions. Musical data can be used whether
composed for traditional diatonic tonality or the n-dimensional tunings
of the microtonal systems. (see Bibliography
#7, Lucy.)
Data to Color Coding
The color coding exploits the well known analogy of color with frequency. The colors are generally assigned in a spectral order - according to the acronym ROYGBIV (red, orange, yellow, green, blue, indigo, violet) or their various transpositions: YGBIVRO, OYGBIVR, etc. This is a simplification. In the HCC, color is assigned according to real values related to nanometer from 380 to 780, the visual band. (see Bibliography #'s 3 M.E.Chevreul , 14 Williamson and Cummins). It will be appreciated that any color ordering and assignment may be used in the HCCS. The display includes UNDERTONES, which may be absent from the physical signal yet are generated and included in the display for reasons of symmetry and because the undertones map neural, perceptual events.
| The intensity of the color band at each radius will vary as the intensity, or the logarithm of intensity, (I=k sigma log f(n)) of each frequency component. Signals higher than the displayed octave bands may be divided by factors of 2 (''octaved down") and signals lower than the displayed octave may be increased by multiplying by factors of 2 (''octaved up") until all signal components are mapped to a single octave. This allows the HCCS to map any range or bandwidth in the same display. | 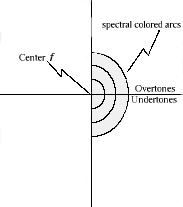 |
Generalization of the HCCS
The invention includes a wide variation of displays ( rectangular, radial, toroidal, and others) that assign colors to musical events: intervals, partials, harmonics, or spectral frequency components, or other aspects of the data being displayed. In addition, stereoscopic or three dimensional displays are also included. For example, visual stereoscopic depth could be used to display different times of signal arrival at the two ears. This would be especially useful for distinguishing collectively a class of problems termed "the Cocktail Party effect" in a visual display.
Advantages of the Harmonic Color Coding system.
A partial list of technological and scientific areas that will be improved and extended by this invention:
|
|
|
|
|
|
|
|
|
|
|
L & s to arbitrary data (Lucy Scale Analysis) |
|
|
|
|
|
|
|
|
|
|
|
|
|
|
|
|
|
|
|
|
|
|
|
|
|
|
|
|
|
|
|
|
|
|
|
|
|
|
|
|
|
|
|
|
III Description of
Drawings/Figures
This figure shows a representation of the HCC
mapping which is the primary subject of this patent.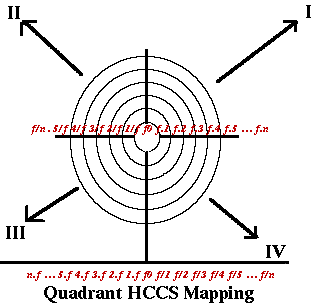
To evoke in vision the richness of music or the patterns in data, the invention is a mapping that transforms parameters of incoming data, especially time series data or music into a flowing, changing, colorful, real-time dynamic visual pattern.
Pitch (frequency) components are mapped to color (hue) in typically a spectral order. The preferred mapping is that lower-end frequencies per octave will appear blue-violet with higher-end frequencies (per same octave), grading up through green to red with a main color sequence of V,I,B,G,Y,O,R.
Frequency spectra for the signal at each instant of event will be plotted with respect to a centered event (f1) frequency with overtones on the +Y axis and undertones on the -Y axis. Signal frequency components an octave apart (1:2, 1:4 ... etc. or 2:1, 2:4 ... etc.) are mapped to the same hue with brightness varying to represent higher/lower octaves. For example, middle C at 261.6 Hz. (C4 of octaves CO - C9, a ten octave compass, Equal Temperament if A4=440 Hz.) (see Bibliography #9, Olson) could be represented by a blue-violet and the octaves 523.2, 1046.5 etc. Hz will be the same blue-violet with the admixture of increasing amounts of white. This preserves and displays harmonic relationships in the data and assigns them a specific color and brightness ordering.
The loudness (amplitude) or volume of a frequency component of a signal will be mapped to brightness (luminance) of the display. For example, low amplitude Hz. at C4 = 261 Hz. will be of a mid brightness blue-violet while higher amplitudes will be displayed progressively brighter.
The preferred function is: Brightness = k * log(amplitude). This corresponds to the observation that a sound must be 4 times the sound pressure to be perceived as twice as loud or a light must be 4 times the luminance to be perceived as twice as bright (Weber's Law, see Bibliography #4 Gregory). It is known that perceived loudness or brightness is proportional to log(intensity). MAXIMUM COLOR SATURATION APPEARS WITH/AT THE FUNDAMENTAL, EVENT ONE (1).
Signals with equal amplitude in all frequency bands will result in a light additive mixture of colors that appear white. Therefore, so-called white noise will appear white in the display. Silent periods (no signal present) will appear black.
Timbre or the frequency spectrum of the signal will be displayed at each instant of time as a set of colored arcs on the display where the color is assigned according to frequency as described above. The brightness of each component arc will be proportional to log amplitude of the signal in each frequency band. The number of color arcs used will depend on the range of frequencies present in the signal, the resolution of the display, and speed of computation available.
Changes in the Display with Time
Signals, or data values or musical signals will be analyzed in real time or at real time into their frequency components. Each component will be assigned a hue, saturation and brightness according to the above descriptions. Groups of colored arcs will appear on the display. New color values corresponding to signal compositions at subsequent times will appear continuously.
For example, a burst of 1/100 of a second of C4 = 261.6 Hz would appear as a single frequency component at 261.6 Hz, may be assigned the color blue-violet and plotted as an arc (event one) at the center of the display.
More complex frequency data will generate more complex appearance. Simultaneously, frequency components of the latest portion of the incoming signals will generate new groups of colored arcs.
The length of the arcs plotted for each portion of the signal collectively form a "pie slice" shape. The arcs stay the same angular size as they move to the periphery. This makes the outer arcs of the display longer. Since the eyes' resolution decreases with increasing angular eccentricity from the fovea, this makes the display constant resolution on the retina.
As the incoming data (music, sound, EEG, EKG, ECP, [see Bibliography #'s 2 & 6 Allesmaudi & Larson] etc.) change, so does the display.The power of various harmonics or partials will vary with time. The effect is a dazzling, dynamic, colored flow of patterns continuously being created and displayed.
Symmetry Considerations
Overtones and Undertone harmonics are displayed in the upper and lower halves of the display as roughly "mirror" images reflected about the central horizontal axis. Left and right stereo signals (or any two signals that are being displayed simultaneously for comparison) are displayed as mirror images reflected about the central vertical axis. (see detailed description of mapping below.) This exploits the early stages of visual processing in the brain called preattentive vision which is very sensitive to symmetries in color, pattern and texture.
Range of Signals
The range of amplitude or frequencies that can be displayed are dependent on the equipment employed in a specific design. Typically, using easily available current art, one can display 16Hz. to 20,00OHz. signals up to 90 dB amplitude range, in 2^32 colors on a 1058 x 1024 pixel display at a frame rate of 75 Hz. The display mapping described here is easily adapted to various data sources and frequency ranges or to a variety of signal analysis equipment.
In some embodiments of the invention, the mapping includes stereoscopic plotting of the color and other data so that the flat mapping described above has the added dimension of visual depth. This is done by several techniques known in current art whereby left and right stereo half-images are presented to the left and right eyes separated by optical viewers, polarized displays etc. Parameters such as loudness or can be assigned to visual depth according to introduced disparity. This would, for example, enhance the tunnel effect described above -peripheral portions of the display would also appear closer to the observer. The disparity required would be introduced by computation on the incoming signal.
Detailed Description
The best mode use of the invention is as a means to teach music, educate Music students, the deaf, or the autistic, the aesthetics and techniques of music by evoking its character visually. Other best modes include the use of the display to represent signals beyond the ordinary range of human hearing as is necessary for analysis of the sounds of cetacea (whales and dolphins). In light of the above, it is therefore understood that within the scope of the appended claims, the invention may be produced otherwise than specifically described.
The HCCS applies to:
A Description of HCCS Mapping
The purpose of this invention is to evoke in vision, the richness of music with its timbres, timing, rhythm and melody. Similiarly patterns in any data or mathematical construct can be displayed as a colorful, real-time dynamic visual pattern. Any mapping system, be it Cartesian, Mercator, Reimanian, Euclidian, etc., assigns properties to the real world or properties in data to some displayed property. (See Bibliography #11 Poston & Stewart).
In a simple Cartesian (x, y) plot, eg. the independent variable x is assigned the horizontal axis and variable y is assigned to the vertical axis. This co-ordinate system has an origin at x=O and y=O. This system is widely used and will be familiar to anyone who has done simple graphing.
In the HCCS mapping, properties of the incoming signal are extracted
by computation and assigned various positions and colors in the display.
The following describes these correspondences for one best mode mapping,
called the HCCS Quadrant Map.
Quadrant Map Description
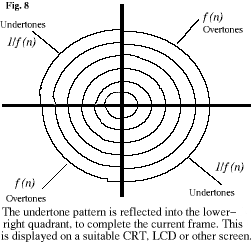
As shown in this figure, the frequency components are displayed in four quadrants. By convention, quadrants are numbered I, II, III, and IV going counter clockwise and starting with the upper right.
The axes of the display are radial. With increasing radius, the displayed frequency increases in quadrants I and III (as Overtones by Division). In quadrants II and IV (as Undertones by Multiplication), the displayed frequency decreases with increasing radius. The origin of the axes is at the center [Event One (1)] of the display. Here the fundamental frequency is displayed, fO.
 |
 |
 |
 |
An innovative, alternative mapping original with the HCCS, is one whereby which the quadrants of the OVERTONE series (QUADS I & III), and the UNDERTONE series (QUADS II & IV) are divided by PRIME (initial) and COMPOUND (duple) events. Thus, PRIME events of the Overtone and the Undertone series would be QUADRANTS I and IV respectively. COMPOUND events would be
QUADRANTS II and III of the Overtone and Undertone series respectively. By Cartesian ordering of the Quadrants, this mapping will place all prime events to the RIGHT OF THE Y AXIS, and all COMPOUND events to the LEFT OF THE Y AXIS, while preserving the signal sequences and the division of the signal into the Overtone and Undertone Series. Thus the visual display of components Prime and Compound are more obvious.
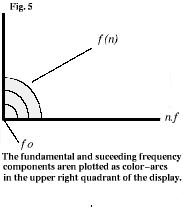
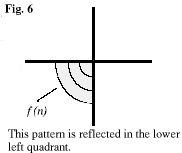
Consider quadrant I. As the radius increases, we see concentric dotted arcs showing where components fO, fl, f2, J3, and so on are mapped. This mapping is reflected and again plotted in quadrant III. Thus quadrant I maps frequencies higher than the fundamental and quadrant III is the reflection of quadrant I.
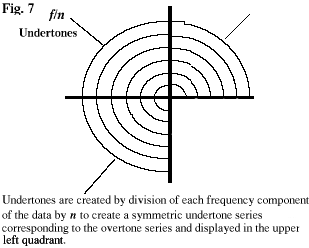
Similarly, quadrant II maps frequencies lower than the fundamental. As radius increases we see concentric dotted arcs showing where frequency components fO, 1/f, 2/f, 3/f ... and so on are mapped. This mapping, is reflected and again plotted in quadrant IV. Thus quadrant II maps the frequencies lower than the fundamental and quadrant IV is the reflection of quadrant II.
So, the HCCS Quadrant Map places an overtone series of fO in quadrants I and III; maps an undertone series of events of fO in quadrants II and IV, and the fundamental in the center of the display in the region of the origin. A typical display maps signals out to 16 times fo and out to 1/16th of f0. It will be understood that the number of separate frequency components mapped will be a function of several aspects of the signal and the display.
Since frequencies are real-value, a radius will be assigned by the map for any value of frequency out to 16 x fO or 1/16th of fO, and any value in between present in the signal.
The resolution of the display, i.e. the numbers of colors available, the size of a pixel or point in the display, will be set by the design of a particular implementation or embodiment of the HCCS. It will be understood that the HCCS Quadrant Map will be substantially the same whatever the implementation that uses it.
Quadrant Map - Additional Properties
We can overlay on the quadrant map, various patterns, similar to reticules on an oscilloscope, that helps emphasize various relationships in the signal, especially harmonic ones.
Three examples follow:
The fundamental is the primary event to which other data is cornpared. The primary event is the fundamental frequency. Event one (1) of sixteen (16) events presently, or thirty-two (32), or sixty four (64), or + .... +n, to which all other data is compared. The fundamental frequency event is assigned a color Hue at maximum SATURATION (minimum white / minimum black admixture of HUE).
VaIue Bias
To distinguish higher from lower octave components in the display, higher frequency components are displayed (+) with increased brightness. The amount of admixed "white" increases/decreases in those quadrants displaying overtones. The opposite direction (-) for (-) increases/decreases toward the black in the undertones. (see Bibliography # 3 Chevreul &14 Williamson).
As described above, frequency components of the signal are assigned a color hue at maximum saturation. The mapping insures that frequencies, which are octaves of one another will have the same hue at varying levels of brightness. It is accepted that the octave ratio is exactly two. To allow greater flexibility of analysis, the value. of the octave rnay be varied, to explore alternative relationships.
Undertones
Undertones are frequencies which move below the fundamental. These are the result of the intermodulation of overtones (which move above the fundamental), or harmonics, at low frequency beating or difference tones, as would occur at I Hz. when frequencies of 34 Hz. and 35 Hz. are botlh present. (see Bibliograpliy # 12 J.G.Roederer,10 V.Persichetti & #15 F.Winckel.
Assignment of Signal Pararneters
Evoking vision onto the richness of music, the display mapping parameters incoming music, other signal sources, or any other time-series data, into a flowing, changing, colorful, realtime, visual dynamic pattern.
The basic transform is designed so that the center (f0) and periphery (fn) of the display, the speed of presentation, and colors are matched to the characteristics of the retina of the eye. This will evoke a powerful response.
The system is designed to be flexible. The most useful presets will be automatically provided for the user who may alternatively choose to precisely control the mapping parameters.
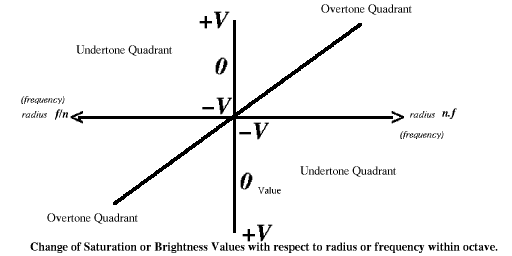 |
| Saturation or Brightness (referred to here as Value) increases for
regions of higher frequency in overtone quadrants (i.e. more white).
Value decreases for regions of lower frequency in undertones quadrants (i.e. less white). |
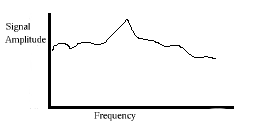
| The amplitude of each component of the spectra will determine the brightness of each color. |
 |
.
HCCS Mapping Process/Algorithrn
1. Acquire signal data, typically using analog to digital conversion in any computerized form.
2. Extract frequency spectral information from the data, typically by use of existing Fourier and Wavelet transform methods. ( see Aware Inc. One Memorial Drive, Cambridge, MA. 02142-1301)
3. For each frame time of the display (typically 1/60th of a second) assign color and position in the display to each spectral component. This involves the determination of the lowest, fundamental frequency using cepstrum techniques or similar computation, should a fundamental be missing for given signal.
4. Create the displayed picture for each frame.
a) Place a color corresponding to the fundamental frequency at the center (event one (1)) of the display.
b) Place overtones of increasing frequency in arc segments of increasing radius, as per HCCS mapping, in Quadrant I.
c) Display a reflected image of the overtones in the Quadrant III.
d) Display the undertone series in Quadrant II similar to the overtone series.
e) If undertones are missing from the data itself, generate an undertone series as the contrasting 4th below reflection of the overtone series.
f) Reflect this undertone series image into Quadrant IV.
g) Display the computed and completed frame on a color CRT or LCD display for (variable) 1/60th of a second.
h) Repeat the above proceedure for the next 1/60th of a second of data.
With adequate hardware and software, the HCCS map can be created and displayed in realtime. Animation, computer animation, or film techniques can be used for applications where the hardware is too slow for real-time operation. Schematics show how the incoming data are transformed according to the HCCS mapping.
Preferred embodiment hardware and software
While there are many devices that could realize HCCS display with quadrant maps, the preferred embodiment is in the form of fast hardware, software and firmware configured as a high speed data analysis computer and display. For music education, the mathematics and computer gaming, the preferred form is a portable device. For applications with high bandwidth data, such as dolphin/cetacea communications studies, the needed high speed dictates designs with special fast data acquisition stages capable of fast transforms and display. Therefore it will be understood that a plethora of possible configurations exist or will be concieved and built in the future. The ultimate test of this invention is that the described mappings prove illuminating in a wide field of data analysis and display that link the aural and visual sensory channels.
The figure below shows the basic design. 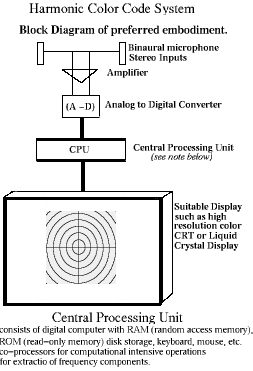
A binaural signal is transduced (detected) by microphones or hydrophones.
(1) Alternatively, any data source could be used. The signals are suitably
conditioned by amplifiers. (2) And then sent to an analog-to-digital converter.
(3) A fast digital computer, such as a MacIntosh II. (4) Apple Computer
with a 68040 processor, RAM, Hard disk and SuperMac Color display transforms
the data to the HCCS format and displays it. To increase the speed for
real-time applications, the current design uses a co-processor, an Intel
I-680 RISC machine running at 80 megaflops. A Mac II compatible version
is available from Star Tech, in San Diego.
The software used for the frequency component extraction is from Aware Inc., Cambridge, MA, which utilizes a "Wavele-t transform" to approximate Fourier coefficients. The code is written in C language and is capable of extracting the frequency components of a signal source some 10 to 100 times faster than the standard Fast Fourier Transform (FFT). Wavelets also have various advantages when dealing with transient, non-stationary signals that seldom approach a steady state. These include speech, music, and dolphin/cetacea sounds.
The Super Mac Technology color display is a 1024 x 1024 pixel CRT, refreshed at 70 Hz. It includes a self-correcting system to automatically maintain the color fidelity of the display. A more portable, smaller version, will be based on the McIntosh Power Book, a small laptop computer. The display will be an InFocus Systems liquid crystal color display. A sufficiently fast LCD will be available late in 1992. The 1-860 may be configured as an add-on chassis connected to the Power Book. In production versions of the HCCS, the necessary hardware will be fitted into the existing Power Book case.
The algorithm is described in the preceeding pages and consists of acquisition of the data, extraction of the frequency spectrum by wavelet techniques and finally, mapping this transformed data to the display according to the HCCS Quadrant map. The parameters of the signal such as amplitude, frequency etc. are assigned brightness, color and position according to the previously described methods.
For signals with high bandwidth, such as cetacea sound emissions, the hardware can be selected so that the data acquisition stages have adequate bandwidth and the digital stages have enough speed to maintain the Nyquist sampling rate of at least twice the maximum frequency present in the signal. For example, for human range sounds, one samples at 40,000 samples/second to represent a 20,000 Hz. signal. For cetacea sounds, sample rates of at least 400,000 samples/second will represent the signal up to 200,000 Hz. Even higher rates may be required for cetacean work since the dolphin may produce sounds at 1 MegaHz.
Another consideration is dynamic range, the difference between the softest and loudest sound. In an orchestra, the dynamic range can be some 95dB. Cetacean sounds have dynamic ranges of some 250 dB. This requires more bits per sample. Typically audio samples are sampled with 16 bits, giving a possible 64,000 amplitude levels. One other way to increase dynamic range is to use Self-Scaling A/D's or placing a logarithmic stage before the A/D so that the logarithm of the signal amplitude is sampled. All these means are well known in the current signal processing art.
To achieve such high data rates may require expansion of the computer portion of the invention. For example up to six Intel I-860 processors may be placed in a Mac H chassis, giving 6 x 80 or 480 megaflops (million floating point operations per second). It will be appreciated that with the rapid evolution of new and faster computers, new art may arise that will be better than the described system for the purpose of the HCCS.
Use of The Best Mode Embodiment
An HCCS mapping system will display in real-time, the musical and harmonic aspects of the signal. In data analysis, this will prove useful for comparison of many signals, especially musical timbre, and topographical geometries.
For musical education, one obvious use is the comparison of a student's
intonation of a musical passage with himself or another model such as a
teacher or the recorded rendering by an acknowledged master For education
of the deaf, the display allows fast, reliable information to the student
on their formation of speech sounds. The applications of the HCCS for display
of data, mathematical constructs and topology are numerous.
We claim an invention, as described above for the conversion of musical, timbral and other signals to a visual form that will evoke substantially the perception of sound in vision. It consists of a mapping, the HCCS Quadrant Map, that maps frequencies in the signal to a color and places these colors in a pattern on a CRT or other display, so the quadrants I and III display overtones of the fundamental frequency and quadrants II and IV, components displayed decrease in frequency with increasing radius.
The amplitude of a given frequency component is represented by increasing and decreasing brightness, with bias of increasing brightness for higher octaves and decreasing brightness for lower octaves. Steroscopic depth is used to encode differences of left and right channels.
The display is accomplished by means of a high speed computer that aquires data, converts it to digital form, extracts the frequency components of the signal and sends a color representation, as described above to a high-speed CRT, LCD, or other display with the image updated at 60 frames per second.
As we have described, one best mode is to use a MacIntosh II computer augmented with SuperMac technology display and an Intel I-860 co-processor running the Aware Inc. Wavelet software.
Thus we claim that we have taught this art of signal to visual
transformation and display to those skilled in the art, in the form of
the HCCS inventions described herein, consisting of the mapping, mapping
algorithms, software and hardware required.
It is a grave mistake to allow tradition to become holy or inspire awe,
for the older it becomes and the more remote is it's origin, the more
confusing the origin.
- F. NIETZSCHE